Why 82% of Net Zero Targets Remain Unverified and How Essential Scope 3 Emissions Data Drives Real Climate Action
- manfredborer
- Jul 21, 2025
- 8 min read
Updated: Aug 23, 2025
Editor's Note:
This article examines why the majority of companies continue to face challenges in verifying Net Zero targets and explores how precise emissions data from supply chains can provide a viable solution. Insights from our Senior Climate Officer, Erinda Utami, underscore the importance of transitioning from generic estimates to science-based, verifiable climate strategies. From the field implementation perspective, Zakhirul Mustaqim, our Producer Engagement Lead, underscores the critical role of producer engagement in collecting accurate, ground-level data that supports credible emissions reporting.

Executive Summary:
Net-zero ambition faces a credibility crisis without credible data. While 53% of Asia-Pacific companies have set net-zero commitments, yet only 18% of them have obtained verification from the Science-Based Targets initiative (SBTi) (PwC, 2025).
Without credible Scope 3 data, most climate goals remain unsubstantiated. Scope 3 emissions are the hidden giant—and challenged to track. Accounting for up to 97% of total emissions in key industries, Scope 3 data is often incomplete or estimated due to supplier disengagement, lack of field-level insights, and outdated calculation models.
The critical role of digital tools, on-the-ground verification, and satellite analytics, such as KoltiTrace and the Cool Farm Tool, enables companies to generate accurate, site-specific emissions data aligned with global standards.
Verified data is the new competitive advantage. From ESG disclosures to climate financing, companies that can prove their emissions reductions gain trust, regulatory alignment, and operational insights—turning climate compliance into market leadership.
Emissions data has rapidly evolved from a niche sustainability metric to a critical driver of business performance, particularly for companies aiming to meet Environmental, Social, and Governance (ESG) targets and achieve Net-Zero commitments. A 2025 study by PwC and NUS Business School found that 53% of companies in Asia-Pacific have set net-zero commitments, an increase from 47% in the previous year. However, only 18% of these companies with net-zero targets have had their targets verified by the Science Based Targets initiative (SBTi), indicating that formal verification remains limited (PwC, 2025). This gap highlights a growing need for robust and credible emissions measurement tools that align with global standards such as those set by the SBTi. Without precise, verifiable data, companies risk falling short of their climate goals and losing stakeholder trust.
As investors, regulators, and customers demand greater accountability and traceability, companies are recognizing that precise emissions measurement has become a strategic necessity. This is where our carbon measurement solution plays a vital role, supporting companies to not only measure emissions across their supply chains but also to generate the credible data required for science-based target setting and verification.
Why Scope 3 Emissions Measurement Is Now Non-Negotiable and a Strategic Imperative
As companies seek to align their climate goals with science-based frameworks, one of the biggest hurdles remains the accurate accounting of Scope 3 emissions, often the most complex and opaque part of the value chain.
Scope 3 emissions, those generated across a company’s value chain, often account for the largest share of corporate greenhouse gas footprints. These include upstream and downstream activities such as suppliers, transportation, land-use change, product use, and end-of-life disposal (EPA, 2023).
In many industries, Scope 3 emissions far exceed direct emissions. In capital goods manufacturing, for example, they can account for as much as 97% of total emissions. In the manufacturing, retail, and materials sectors, disclosed upstream emissions were on average 26 times greater than operational emissions (Scopes 1 and 2) in 2023 (CDP, 2024).
Measuring these emissions enables companies to:
Identify the emissions hotspots
Access to climate finance and carbon markets
Meet evolving ESG reporting and regulatory requirements
Unlock operational efficiencies and cost savings
Strengthen supplier collaboration and innovation
Demonstrate credible tracking progress toward Net Zero targets
Measuring Scope 3 emissions is key to understanding a company’s full climate impact. As the largest source of emissions for many organizations, they play a vital role in achieving net-zero goals, meeting stakeholder expectations, and driving meaningful change across the value chain.
Table of Contents:
Why Companies Struggle to Measure Supply Chain Emissions
Despite the critical importance of Scope 3 emissions, many companies, particularly in agriculture and land-based sectors, face significant challenges in measurement and management. These include:
Lack of Specific and Verified Data
Most companies still rely on generic emissions factors or databases that lack supplier-specific data and overlook regional supply chain differences. According to a 2024 GHG Protocol survey, many companies use spend-based models and proxies due to limited access to supplier-level data, limiting accuracy in reflecting local practices and impacts (GHG Protocol, 2024).
Compliance Complexity
New and emerging regulations require detailed, site-specific, and product-level emissions data. For example:
SBTi Forest, Land and Agriculture (FLAG) Guidance mandates emissions reductions and removals for agriculture, forestry, and land-use sectors (SBTi FLAG, 2022).
ISO 14068 (2023) sets new criteria for greenhouse gas reporting and validation in supply chains (ISO 14068, 2023).
The EU Corporate Sustainability Reporting Directive (CSRD) requires detailed emissions disclosures, including Scope 3, for large companies operating in Europe (EU CSRD, 2023).
Unverified Climate Initiatives
Without accurate measurement, companies struggle to validate the results of regenerative agriculture or carbon insetting programs, reducing the credibility of their ESG reporting.
These challenges create both regulatory risk and missed opportunities for companies to reduce costs and enhance resilience.
Enabling Verified Supply Chain Emissions Data Through Ground-Level Insights and Technology
Through our KoltiTrace MIS platform and on-the-ground support from trained agronomists and field agents, we empower companies to move beyond estimates and gain verified, traceable emissions data across complex agricultural supply chains. This creates the foundation for credible Net Zero strategies and effective climate action.
“Rather than using precise, farm-level data, many companies still depend on broad estimates or industry averages to calculate their emissions,” explains Erinda Utami, Senior Climate Officer at KOLTIVA. “Our approach combines digital traceability and ground-level verification, helping companies generate accurate, plot-specific emissions data that is critical for credible reporting and actionable climate strategies.”
To support a more accurate GHG accounting, we provide tools for estimating emissions from both deforestation and on-farm activities, as follows:
Land Use Tracker – GHG Analysis
Our Land Use Tracker provides monitoring of GHG emissions linked to deforestation in the last 20 years—one of the largest emission sources in agriculture. This aligns with the Food and Agriculture Organization’s (FAO) analysis, which identifies deforestation due to land-use change as the single largest GHG emission source in the agri-food system. In 2019 alone, land-use change—including deforestation—contributed 3,058 Mt CO₂e, surpassing emissions from enteric fermentation and supply chain activities. (FAO:2021)
Key Features:
Land Use Tracker Dashboard
Offers clear, aggregated emissions data for selected countries, regions, years, and commodities. Users can access metrics such as deforested areas, GHG emissions per hectare and per ton, forest type affected, and client-specific emission shares.

Land Use Tracker Dashboard showing deforestation and supply chain emissions data by region, year, and commodity. Land Use Change (LUC) GHG Map Visualization
Provides interactive maps showing historic land-use change emissions for any crop, globally. The system estimates carbon dioxide equivalent (CO₂e) using regional data on carbon stock loss from forests cleared in the past 20 years. It also maps deforested areas within the farm to track land-use changes.

GHG map showing global land-use change emissions and deforestation data by crop. This methodology aligns with best practices from Quantis (2019), the Accountability Framework Initiative (AFI), GHG Protocol, and SBTi Forest, Land, and Agriculture (FLAG) Guidance (2022).
How It Works:
Step 1: Polygon Acquisition
Field agents or users map precise farm boundaries using the KoltiTrace MIS mobile app, creating "polygons" that define each land parcel under assessment.
Step 2: Land Use Change and Deforestation Analysis
The system overlays these polygons with satellite-based deforestation maps and spatial datasets, detecting any forest loss or conversion for agricultural use. It isolates land-use changes specifically within the mapped farm areas.
Step 3: Visualization and Reporting
Results are displayed via:
Interactive LUC GHG Map: Visualizing detected land-use changes within the supply chain.
LUC GHG Dashboard: Providing GHG emission summaries, trends, and deforestation insights.
These tools deliver actionable, site-specific data that supports emissions reporting, compliance, and targeted climate action.
Traceability through these tools enables companies to pinpoint emission hotspots and take targeted actions that lead to measurable carbon reductions. It moves beyond regulatory reporting by offering a practical foundation for proactive mitigation and long-term climate impact.
Cool Farm Tool GHG Assessment
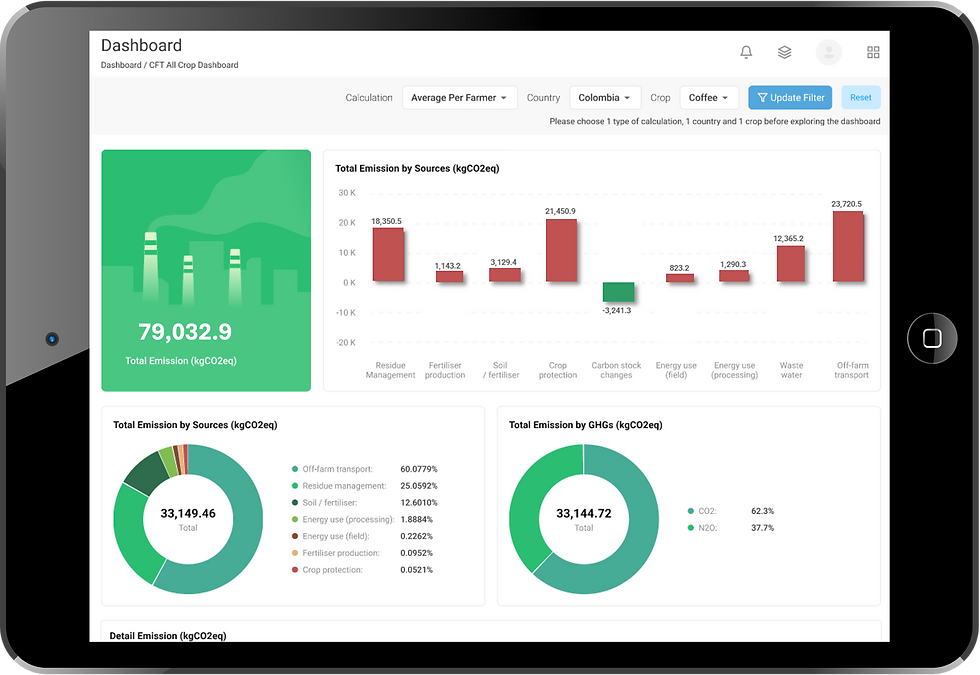
To complement our land-use analysis, we integrate the Cool Farm Tool (CFT), a globally recognized greenhouse gas calculator for on-farm agricultural practices, aligned with Intergovernmental Panel on Climate Change (IPCC) methodologies.
Key Features:
Calculates GHG emissions from agricultural activities such as fertilizer use, fuel consumption, pesticide application, and crop management.
Provides detailed emissions profiles from raw material sourcing up to the factory gate.
Identify the reduction opportunities based on the emission hotspots.

The Critical Role of Local Field Agents in Ground-Truthing Emissions Data
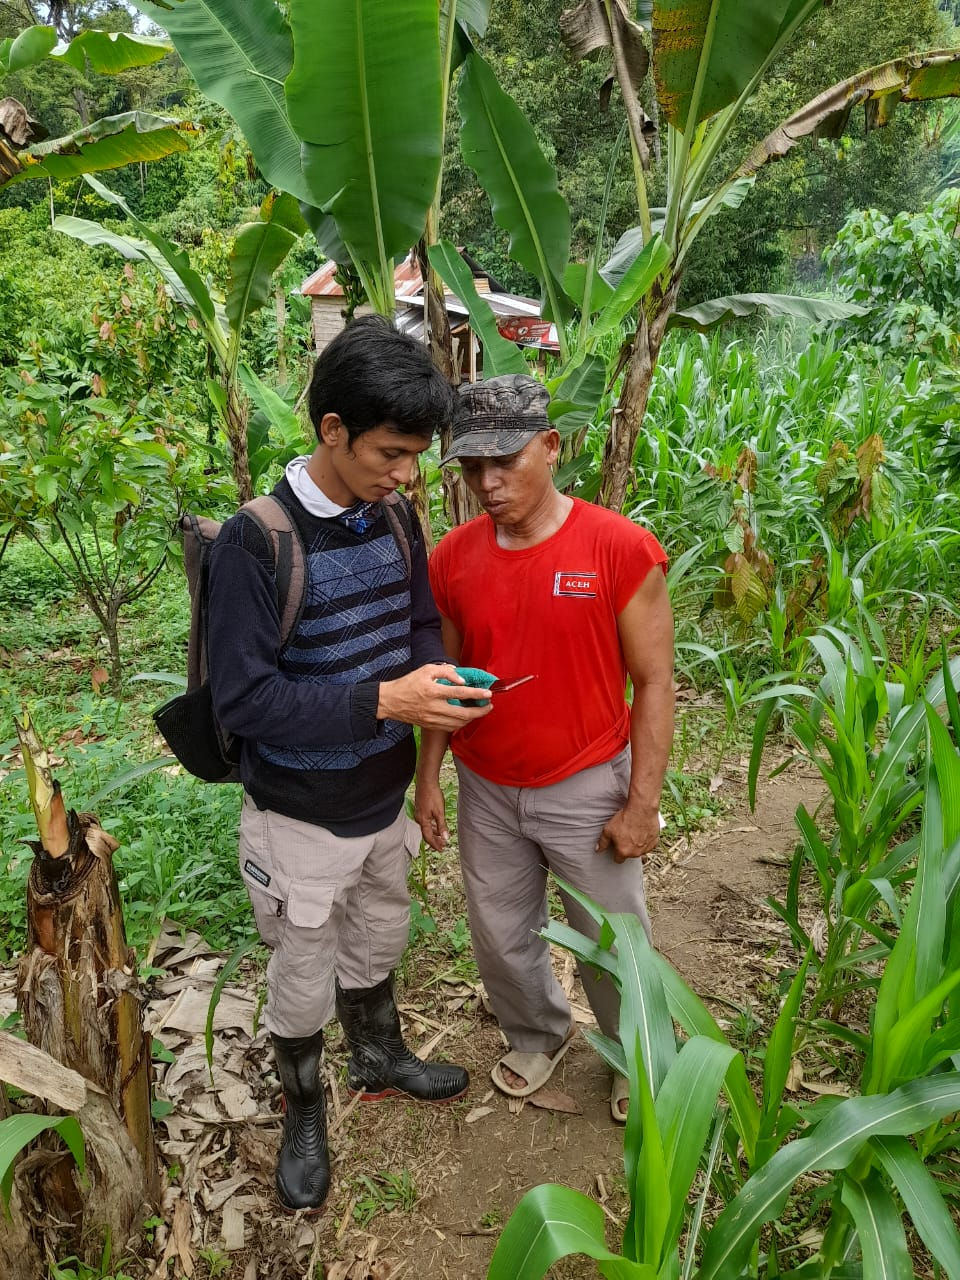
We work with local field agents and agronomist experts who are extensively trained in GHG monitoring, including the Cool Farm Tool methodology. They assist growers and suppliers in completing surveys to ensure that data reflects real field conditions, not assumptions made behind a desk. This ground-level presence builds trust and ensures consistent, high-quality data collection across fragmented smallholder landscapes.

Zakhirul Mustaqim, KOLTIVA’s Producer Engagement Lead, emphasizes the value of this direct engagement in turning data collection into meaningful action: “Assessing emissions using the Cool Farm Tool gives us a clear entry point to guide producers with practical suggestions, whether that’s improving land preparation, adjusting input use, or turning cocoa pod husks into organic fertilizer or biochar. Tailored insights like these are far more likely to be adopted.”

Through one-on-one coaching, Field Agents help producers understand the emissions linked to their current practices and identify realistic ways to reduce them. This support plays a critical role in helping producers meet the requirements of various sustainability standards.
“When producers see how their data contributes to actual climate goals, they become more engaged. That participation is essential for driving meaningful change,” Zakhirul explains.
The benefits of field-level verification extend beyond individual farms. Emissions data collected through this process also supports NGOs, local governments, and private sector actors in understanding emissions profiles at both the landscape and commodity levels.
“We’ve seen how verified data from the field informs broader decision-making,” Zakhirul adds. “For example, in Southeast Aceh, we’re using this data to understand emissions across the cocoa supply chain, not just at the farm level, but across the entire landscape.”

This boots-on-the-ground approach enables companies to:
Build accurate, verifiable Scope 3 emissions inventories
Engage upstream suppliers in measurable and collaborative climate action
Strengthen assurance for ESG disclosures and sustainability certifications Inform decision-making based on environmental performance and real data
By embedding traceability and field verification at the core of emissions monitoring, businesses move beyond reporting for compliance. They gain a practical pathway to reduce emissions, enhance producer collaboration, and meet climate commitments with confidence.
Start transforming your Scope 3 data into a competitive advantage. Talk to KOLTIVA’s expert today.
Author: Maria Marshella Gaviota, Marketing Communications Officer at KOLTIVA
Subject Matter Expert: Erinda Utami, Senior Climate Officer at KOLTIVA and Zakhirul Mustaqim, Producer Engagement Lead at KOLTIVA
About the Experts:
Erinda Utami is the Senior Climate Officer at KOLTIVA, specializing in greenhouse gas accounting, climate-smart agriculture, and supply chain traceability. She works closely with agribusinesses and global corporations to develop verifiable climate strategies rooted in science-based methods and local realities.
Zakhirul Mustaqim is the Producer Engagement Lead at KOLTIVA, responsible for strengthening collaboration with smallholder producers through direct field engagement and tailored support. He oversees on-the-ground implementation activities, ensuring that data collection is accurate and that producers receive practical guidance aligned with sustainability and compliance goals. His work plays a key role in connecting field realities with broader supply chain strategies.
Resources:
PwC Singapore, & NUS Business School. (2025, May 21). Strong net zero commitment among Asia Pacific companies with improved GHG emissions disclosures: PwC and NUS Business School. PwC Indonesia. https://www.pwc.com/id/en/media-centre/press-release/2025/english/strong-net-zero-commitment-among-asia-pacific-companies-with-improved-ghg-emissions-disclosures-pwc-and-nus-business-school.html
United States Environmental Protection Agency. (2023). Scope 3 inventory guidance. https://www.epa.gov/climateleadership/scope-3-inventory-guidance
GHG Protocol. (2024, March). Scope 3 survey summary draft. https://ghgprotocol.org/sites/default/files/2024-03/Scope-3-Survey-Summary-Draft.pdf
Science Based Targets initiative. (2022). Forest, land and agriculture guidance. https://sciencebasedtargets.org/sectors/forest-land-and-agriculture
International Organization for Standardization. (2023). ISO 14068-1:2023—Greenhouse gas management and related activities—Carbon neutrality—Part 1: Specification with guidance for use. https://www.iso.org/obp/ui/en/#iso:std:iso:14068:-1:ed-1:v1:en
European Commission. (2023). Corporate sustainability reporting. https://finance.ec.europa.eu/capital-markets-union-and-financial-markets/company-reporting-and-auditing/company-reporting/corporate-sustainability-reporting_en


This article highlights something often overlooked in net-zero conversations: the how. The combination of satellite analytics and farmer engagement feels like a smart way forward. Thanks for making this complex issue so accessible!!
Congrats to Koltiva for contributing to real climate progress. Helping companies tackle Scope 3 emissions through better traceability is a vital step toward verified net zero targets.